
This Saturday late in the afternoon, a client to whom I am doing maintenance for told me that his web site is very slow. Saturday, last minute… Slow WordPress: Murphy always watching over us 😉
The first thing I do is to check it and indeed I see that the load times are up to 15 seconds … and looking at the possible problems I see that the home page weighs more than 15Mb, in the end I will go to that part, the case is that going to other pages such as the store (it is a WooCommerce), with a weight within the normal, the problem remains the same.
Nothing had changed on the website, I certainly hadn’t upgraded to WordPress 5, I had executed some plugin updates, but nothing that I thought was significant, the administration part was also very slow.
I contact the hosting, as it seems that there was saturation on the phone line (Murphy, are you still there?), I end up putting a ticket.
The first response from support is that there are too many IOPs, to activate caching (there are already several in use) and to contact an experienced WordPress specialist to optimize the website and use fewer IOPs (the ticket is written on behalf of the customer).
At this point and after one o’clock in the morning, I call again by phone, yes, the webs have no schedule, and from the technical service of the hosting they take careful note of everything that I indicate and they tell me that soon they will answer me in the ticket.
Finally they answer me that the high consumption of IOPs is due to queries to the database, such as:
SELECT
    t.*, tt.*, tr.object_id, tm.meta_value
FROM
    wp_terms AS t
        INNER JOIN
    wp_term_taxonomy AS tt ON t.term_id = tt.term_id
        INNER JOIN
    wp_term_relationships AS tr ON tr.term_taxonomy_id = tt.term_taxonomy_id
        LEFT JOIN
    wp_termmeta AS tm ON (t.term_id = tm.term_id
        AND tm.meta_key = 'order')
WHERE
    tt.taxonomy IN ('product_type' , 'product_visibility',
        'product_cat',
        'product_tag',
        'product_shipping_class',
        'pa_color',
        'pa_talla',
        'pa_talla-calzado',
        'yith_product_brand')
        AND tr.object_id;
Well, we’ll leave it for Sunday morning, it’s already after 3 o’clock…
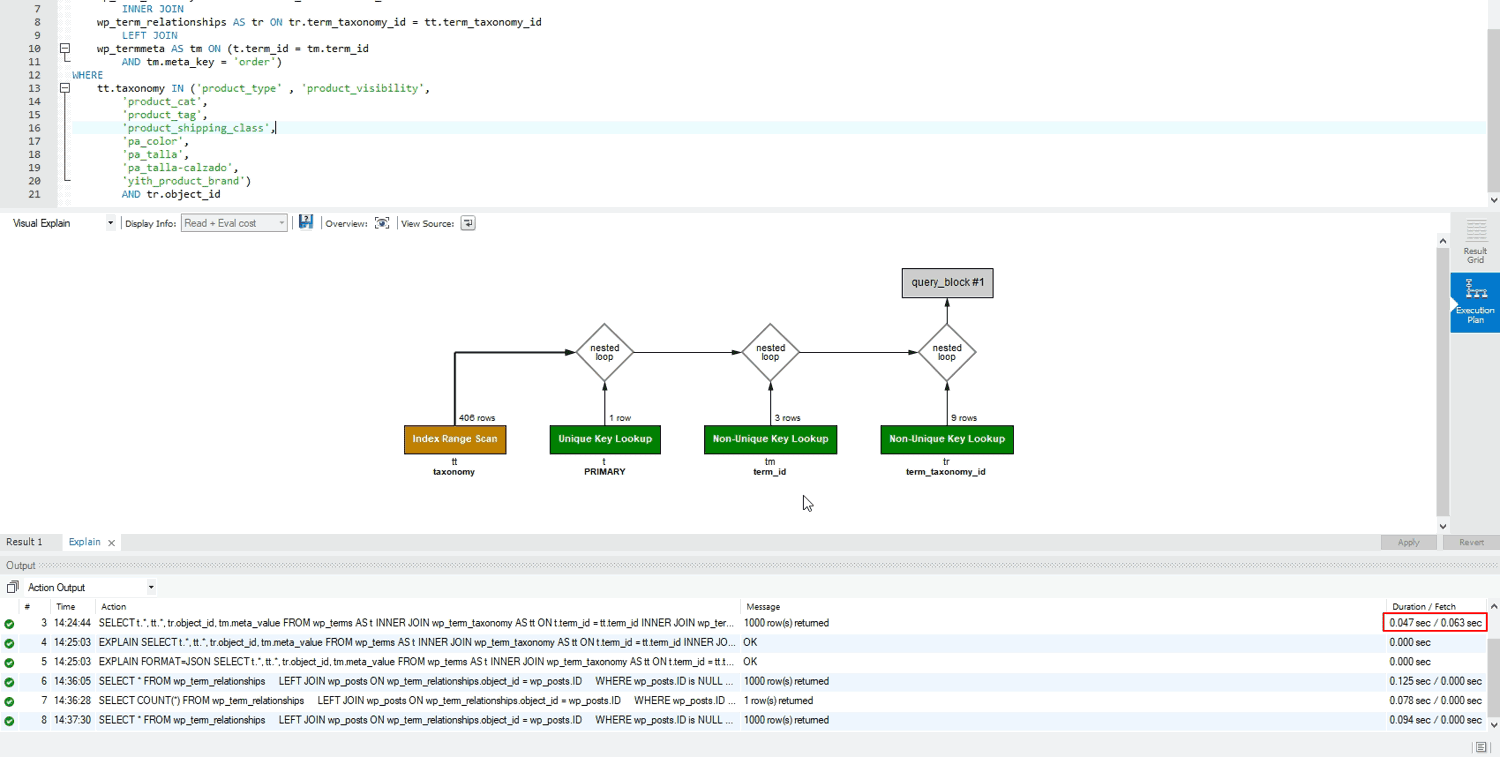
We run the query and I see no problem, as it runs in 0.063 seconds. Time to get down to business with the database.
Optimizing the database
The first thing I do after logging into phpMyAdmin is to optimize all the tables to eliminate waste and see if the times improve.
Then from the remote MySQL option of the cPanel I add my public IP to connect directly to the database. This time I use MySQL Workbench and once connected, the first thing I do is to make a backup of the database.
I then run the query again with the same times as the result. If we prefix the query with EXPLAIN it will explain each of the steps taken in order to see the possible problems, indexes to improve, etc., but we can also tell it to dump these results as JSON with EXPLAIN FORMAT= JSON
When we connect to MySQL Workbench, in the window to execute the query we have an icon to execute it with EXPLAIN and see it in tabular or graphical form (through the EXPLAIN FORMAT= JSON), in this last one it will mark in red the slow steps, orange the steps to improve (average execution cost), green the optimized ones, among other options.
In the above query we see that it could be improved, but it does not perform badly (0.063 seconds) enough to slow down the website.
Well, let’s look at other options and then see if we can optimize further.
We see that the wp_term_relationships table has 42,791 entries, surely there are many unused entries that have been left over time, so we run:
SELECT COUNT(*) FROM wp_term_relationships
    LEFT JOIN wp_posts ON wp_term_relationships.object_id = wp_posts.ID
    WHERE wp_posts.ID is NULL;
And we see, that indeed, there are 3,377 orphaned entries, so let’s delete them (remember, previous backup of the database and also remember to put the appropriate table prefix):
DELETE wp_term_relationships FROM wp_term_relationships
    LEFT JOIN wp_posts ON wp_term_relationships.object_id = wp_posts.ID
    WHERE wp_posts.ID is NULL;
And the query should tell us that 3,377 rows have indeed been deleted, so we optimize the table again:
OPTIMIZE TABLE wp_term_relationships;I also notice that there are MyISAM tables coexisting with InnoDB, maybe the first ones of the initial installation, by the way, the database engine is Percona Server. The next step is to convert them to InnoDB with the command for each table:
ALTER TABLE nombretabla ENGINE = InnoDB ;
* Note from 11/03/2022: we can obtain the name of all tables in MyISAM format with the following query:
SELECT TABLE_NAME FROM INFORMATION_SCHEMA.TABLES WHERE TABLE_SCHEMA = 'nombre_base_de_datos' AND ENGINE = 'MyISAM';With the result we can then create the query ALTER TABLE to convert all tables into a single statement.
Inspecting post_meta
We will start with a query to the post_meta table, that table where information about pages, posts, products, CPTs, etc… is stored and we will see what we can do with it:
SELECT * FROM wp_postmeta pm LEFT JOIN wp_posts wp ON wp.ID = pm.post_id WHERE wp.ID IS NULL;And it turns out that it returns no less than 7,147 rows of post_meta data that do not correspond to entries in the posts table, i.e. orphaned data, so let’s delete them:

DELETE pm FROM wp_postmeta pm LEFT JOIN wp_posts wp ON wp.ID = pm.post_id WHERE wp.ID IS NULL;And we have the result: 7,147 affected rows (The query took 1.8589 seconds). What deleted more rows than the ones shown as empty? What went wrong and you were left without database? It’s ok, recover the backup of the database and restore because you will have a backup from before you did this, right? it won’t be that I didn’t warn you…
Remember to always optimize after deleting records in your tables.
Now let’s take a look at a query that can provide us with very interesting information:
SELECT MAX(t1.post_id) AS `post_id`, MAX(t2.post_date) AS `Date`, SUBSTRING_INDEX(t1.meta_key, '_', 1) AS `Meta`, (SUM(LENGTH(meta_id)+LENGTH(post_id)+LENGTH(meta_key)+LENGTH(meta_value)))/1048576 AS `Size MB`, COUNT(*) AS `Count`
    FROM wp_postmeta AS t1
    JOIN wp_posts AS t2
        ON t1.post_id = t2.ID
    WHERE meta_key NOT LIKE '\_%'
    GROUP BY `Meta`
    ORDER BY `Size MB` DESC, `Date` DESC;
With the following result in our database:

As we can see in the result, we obtain very relevant data such as the Meta with the most entries, those that occupy the most space in the database or those that have been used for the last time.
Let’s go to SQL. First of all we see that with MAX we select the highest Id of that meta, as well as the last date (MAX), at the end of the query if we change the ORDER BY we can sort them by that date, by the number of entries or by the size (as it is in this case).
Next we select the meta_key to which we eliminate the low bar _, that we added so that the meta does not appear to the user and this will be the field by which we will group with the GROUP BY to be able to make the calculations of each Meta.
And now comes one of the most interesting parts: we find the length of the fields meta_id, meta_key and meta_value and add them with SUM and the result is converted to Mb. dividing by 1,048,576 (1024 x 1024). This way we know what each Meta group occupies (no, we are not talking about Walter White in Breaking Bad).
And finally we count how many goals we have of each type with COUNT. As we already said, we group by Meta and sort by the field or fields we want, obviously we make a JOIN (a INNER JOIN) between the tables posts and postmeta (remember the appropriate table prefixes).
Now it is up to us to correctly interpret this result and see what occupies more and sometimes is no longer used, weighing if for example in our case it is worth having Smush that optimizes our images but has generated more than 24Mb. of data in our table 🙁
Here a slap on the wrist for its developers, in this case to create a small table for your plugin was a good option and not to slow down such an important general table to which all carry their garbage. Developers have a great responsibility with how our code will be used and optimize for the worst-case scenario.
Well, with these results we can decide whether to delete entries with a DELETE (always previous backup and consultation with SELECT to see how many rows would be deleted).
Plugin for queries
An extremely useful plugin is Query Monitor that will indicate the slow queries of each page, number of queries, who performs them, among other information of great interest … but I do not recommend you to put it in production.
In this case, as the hosting has such a function, I created an identical staging copy, installed the plugin and from there located some problematic queries with a particular plugin, which also as it was not used now, we moved immediately to deactivate. This action would have been extremely complicated in Live as it was producing 503 errors and the increased load would make things even worse.
We always have the option to deactivate plugins and activate them little by little and checking each step, but if I already spent a few hours at night and most of Sunday with this … with the option to deactivate / activate would still go a few hours more.
An extremely good option, one of the best you can find, for detecting slow queries and all kinds of tests is with New Relic, which I have used successfully on other occasions.

I could clone the site to a Pantheon test site that I sometimes use and from there inspect it with the New Relic integration they offer, but on this occasion it was not necessary.
It is a pity that I did not have access to the slow log of the database since the hosting does not give access to it (I guess because it is shared). On a dedicated server I could also tweak the database cache parameters, but this is already out of the topic of this post. However, I have to thank the hosting staff for copying the 10 slowest queries for me to take a look at them.
The images
This is something that I never tire of repeating… optimize the photos, do not put a photo of 3000 pixels to show it at 200 px, a photo in png that in jpg would occupy much less, or that logo in jpg, that with a png of 32 colors (or even 16) would occupy 3 times less… each format has some characteristics and is ideal for a type of image, this is not the right post to tell you the ideal of each image but I am going to give you a general rule:
Your images should NEVER weigh more than 100 kb. If they weigh more, they should be optimized and if you have to break the rule (sometimes you have to make exceptions), do not exceed 150 kb., if it reaches 200 kb. it should be for a good reason and only if it is for high resolution download or some other unusual case.
But also, never. neVER, NEVER use images linked to third party websites because you will be consuming their bandwidth, at any time they can remove it and you will be producing a 404 that will slow down your website or worse, they will change it for another that weighs much more (several megabytes and you can throw your website) or a totally inappropriate image (I remember a case with a local newspaper).
In this case, the home page showed a slider at the bottom of the page with the latest blog entries and their thumbnails of used images of about 2Mb, plus some external images of 2Mb that, to make matters worse, loaded very slowly.
To optimize a slow website, to make WPO or a punctual intervention is not to follow a manual, but experience, time, patience (a lot), knowledge in several fields (SQL, servers, PHP, HTML, CSS… yes, CSS can slow down a website more than we can think, javascript…).
Of course we have many more optimization options, check all the options in autoload (programmers, do not always mark the options as autoload, then everyone says “was it me?“), among many other options, but for that you can always look for a good WordPress professional to do it for you, right?
I hope that these small brushstrokes of a performance by our friend Murphy will help you in your day to day life.
P.S. (06-02-2022): To know the size of the options loaded in autoload (in MB):
SELECT SUM(LENGTH(option_value))/1048576 AS autoload_size_MB FROM wp_options WHERE autoload IN ('yes', 'on');P.S2. (26-03-2024): To know the size of the options loaded in autoload in order of size in KB:
SELECT option_name, ROUND((LENGTH(option_value)/1024), 2) AS autoload_size_KB FROM wp_options WHERE autoload IN ('yes', 'on') ORDER BY autoload_size_KB DESC;